The Assumption of IID
As a statistician, you soon find out that more often than not data carries deeply embedded scars from the process of its origination. Such scars do not show up easily but insidiously bias the results of your study quietly letting you celebrate your findings. If findings are unlikely, a veteran scientist might sit down like a seasoned psychologist and meticulously interrogate the data to find out these scars. If she ends up finding some of them, she will find understand the data better and devise ways for these scars to not affect her study. If after the best of her efforts, she does not find any of these scars she will eventually trust the data and conclude that the results are valid.
These scars are nothing but biases in the source of data that render the sample incapable of representing the entire population. For instance, if you look for the prevalence of teetotallers in front of a wine shop, then your sample will never accurately represent the population. Sometimes these biases are easy to spot, but sometimes they are much harder to spot. In most cases when data is biased, you cannot consider that samples come independently and identically from a population. They are either held dependent by the source of data, or they sometimes change their underlying distribution.
Independence means that the (n+1)th sample that you draw from the population is perfectly independent of the first n samples that you have drawn. So, say you were to collect data on human heights and you went out into the world and started picking your samples at random, every next person you select will be entirely independent of the last person you had selected. But now imagine, what if you decided to include only men in your study and no women? Every subsequent datapoint will be tied to all other data points by the attribute that all are men. The samples in this case would not be independent, but only conditionally independent (condition: that the person is male). Conditional Independence suggests that these points will be a good fit if you were looking to find data only on male human heights.
Identical means that the underlying distribution does not change itself in the process of you picking out samples from the study. Imagine that you are trying to collect data on how many months on average an employee sticks around at your workplace. So, on every resignation, you plan to note down the number of months in your diary. The distribution you are looking at will itself change as you spend more time in the organization. This is because your list will be biased towards people who have worked for a lesser time than you. There will be a lesser chance that the resignation of someone who has spent more time than you falls in the window of your stay at the organization. (This is called observer bias).
And hence, as you spend more time the distribution of months spent in your source of data will change. So, each subsequent sample might not be coming from a distribution identical to the initial distribution. An accurate picture I found to describe the distribution over time is as follows:
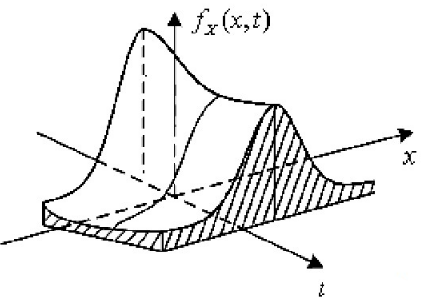
Independent and Identical together try and enforce that the sample is always representative of the overall population. Non-stationarity in effect is a specific case of identicality.
The Story of Abraham Wald
One such story of scarred data comes from World War II and as it happens the scar was such that it entirely tossed around the inference that the data was suggesting. Abraham Wald was a Jewish statistician who was working with the Statistical Research Group (SRG) in the United States. SRG tried to understand the processes of war and tried to solve problems concerning the military. One such problem was that fighter planes had a high crash rate at the time and the US military wanted to armor them in the most sensitive places.
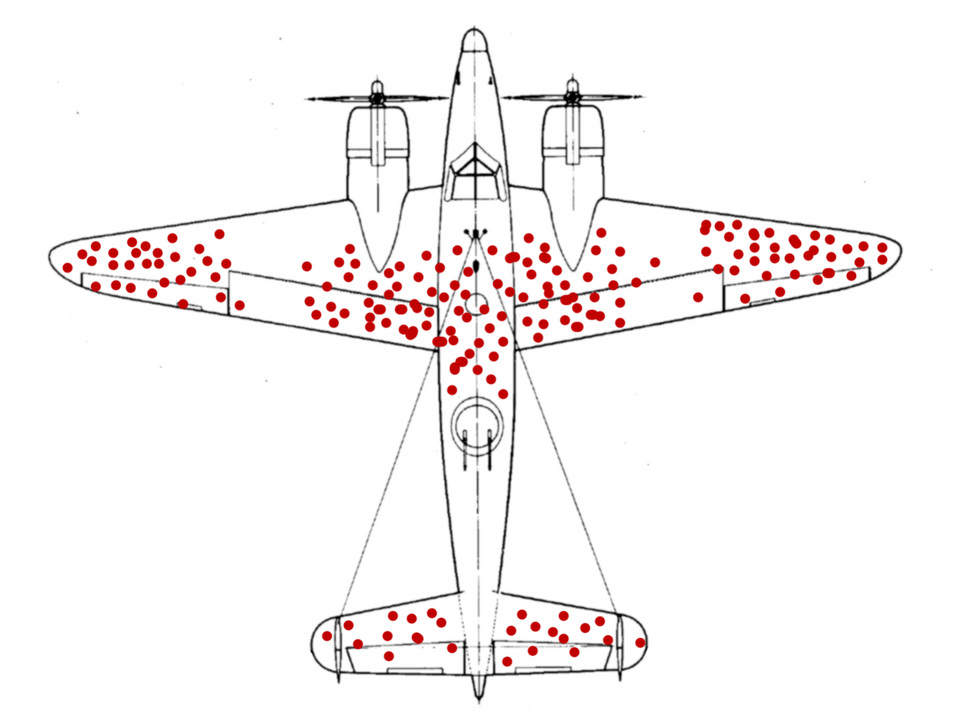
A team of statisticians started analyzing the planes that came back from war and created a distribution of bullet points on the plane. The image that you see represents those bullet points on a plane. Look at it for a second and try to answer these questions. Do these data points tell a story on which parts need to be strengthened? Are these bullet points independently and identically distributed?
The conclusion that the team made out of this picture was that the parts that are having the most amount of bullet hits should be heavily augmented with extra armor. The parts that are not getting a lot of bullet hits are good to go. Assuming the sample bullet points paint a reasonable picture of the entire population of bullet points, then this conclusion was apt and the team was on the right track.
But Abraham Wald had a different perspective on the data. While the team was focused on the picture that the data was showing, Wald was trying to understand the scars that the data has been through. Wald was convinced that it was unlikely that the distribution of bullet points on a flying plane would be anything but uniformly distributed across the plane.
In that case, he reasoned that the planes that had bullets on the nose, the engines, and the central body were also the planes that never came back from the war grounds. If you ever visit a war hospital he said you would not see more patients with bullet wounds on their chest or head. You will see more patients with bullet wounds on their arms and legs because the former probably never made it to the hospital.
After realizing this, Wald realized that the weakest spots of the plane are exactly where you cannot see the bullet holes. The recommendation Wald had was completely opposite to the initial strategy. Wald deciphered that the right places for extra armor are the nose, the engine, and the central body (the places where there were no bullets in the data collected).
The story of the astute insight by Abraham Wald is primarily a story of how survivorship bias led to the violation of an assumption that guaranteed that the sample would be representative of the population of bullet hits. This assumption was that of independent and identically distributed (IID). The assumption of IID often breaks down at the source of your data and the way you collect your data. Tailoring the data and the study to ensure the assumption is met is the job of a statistician and a scientist.
When does data become non-IID?
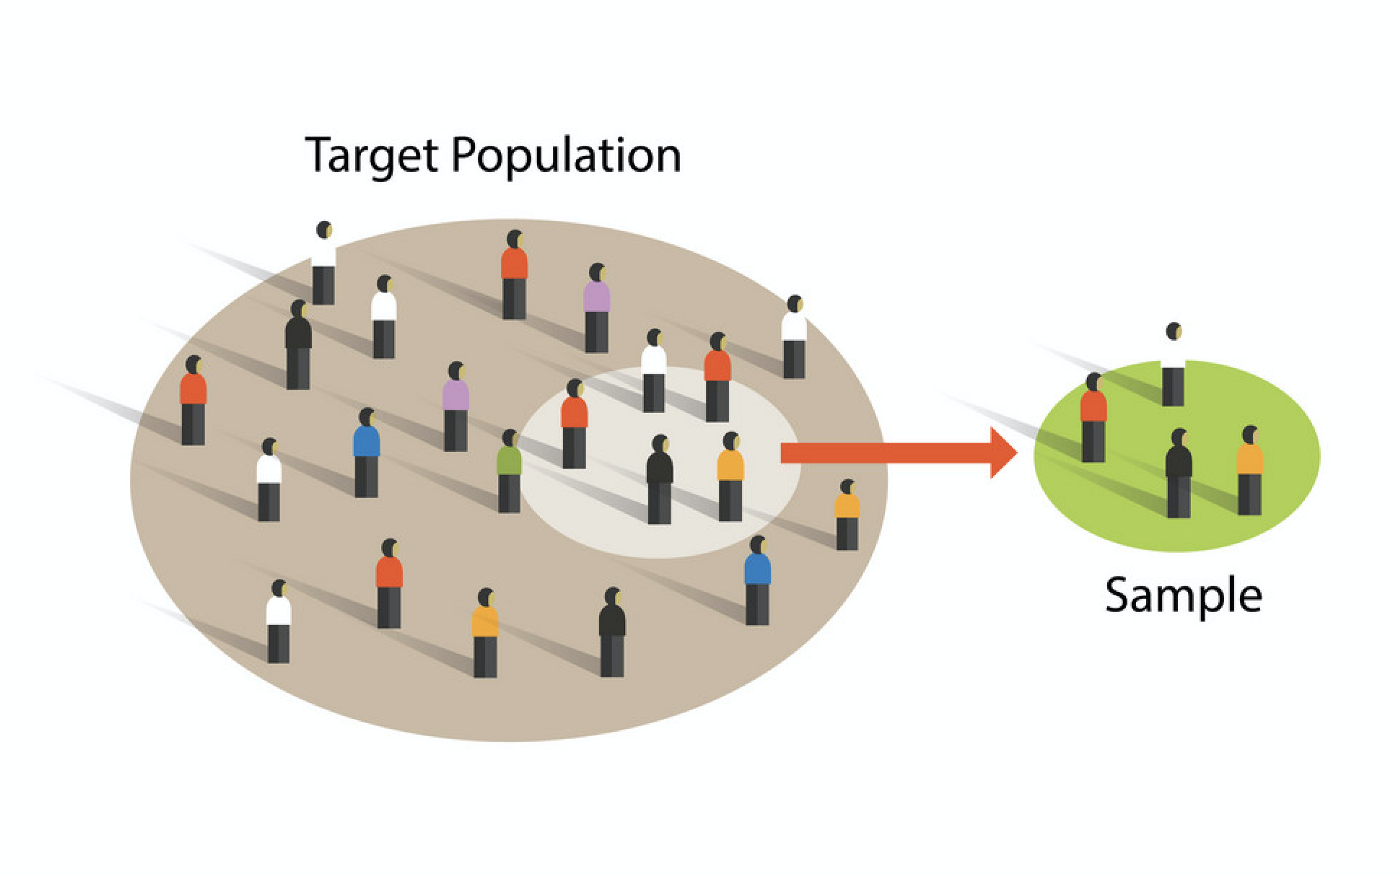
The source and structure of data are often the reason that they are non-IID. Intuitively, most statistical algorithms imagine that a sample is like a bunch of MnMs you grab randomly from a big bowl into your hands. Sampling theory makes a crucial assumption hinged upon this image. As the number of observations increases, you become exponentially sure about the actual distribution of the true population.
If you read how a t-test works here, you will find that this crucial assumption from sampling theory helps us define the variance of the learned mean. This is the central assumption that breaks down whenever samples are not independent and identically distributed.
At times you may find non-IID characteristics in time-series data such as the stock price. Today's stock price value will always depend on yesterday's price. Markov Chains are statistical instruments that do not make the IID assumption, but rather make an assumption of conditional independence that helps them analyze time series data.
At other times, you will realize that various types of biases such as survivorship bias, selection bias, and observership bias restrict some part of the population to reach the sample and hence create the violation of the IID assumption. There will be times when you will be able to find a better source of data, and there will be times when you will have to change the interpretations to fit the bias.
The violations of IID emerge in the process of the datapoint becoming a sample. When unfair advantages are given to some scenarios over the other, the samples show a biased picture of the population as well. All common biasses such as the observer's bias, survivorship bias and the selection bias undermine the probability of some datapoints to land in your data-set. This is the primary reason that the data gets biased.
However, it needs to be noted that bias is relative to the question you are asking. Often if the question is changed, the same dataset acts as a fairly good sample. For instance, if we were to ask about the distribution of bullet points on planes that return from the war grounds so that the respective parts are stocked better in inventory then the given dataset would be a perfectly good sample.
Ways to adjust for non-IID
Once a statistician understands the biases their data has been through, they are able to devise creative solutions to the problem at hand. Biased Data is not something that you necessarily throw out of the window. Data has juice and you might do various things to use the juice to solve parts of your problem.
- Change the source of data: A statistician might first try to change the source of his data but if she is a good and seasoned statistician, she probably would have already considered his options and chosen the least biased data source.
- Change the scope of the question: Often a statistician might change the scope of the question and realize that there are some parts of reality he cannot comment on. She probably can only provide an analysis under some assumptions and hence clarifies them in her study.
- Apply transformations to the data to better-fit assumptions: There might be scope to transform the data in a way that she can still use it for her study. For instance, stock prices are highly non-stationarity but if she detrends the data (fancy word for taking subsequent differences), she might find that the daily returns on the stock price are closer to being independent.
- Change the instrument of analysis: Oftentimes, the statistician might look for a better statistical instrument with more fitting assumptions to solve her problem. Advanced statistical models often make assumptions of conditional independence to leverage the data to make some conclusions. For instance, the famous ARMA, and ARIMA models in time series are based on the assumption of auto-regressive nature. Auto-regressive makes an assumption that the 'nth data is dependent on previous 'p' data points and not on data points before that.
There are various things you can do when you find out that your data is scarred. Always try to narrow down on the limitations of the data and think through on what can be done. You can also go through the statistical literature on the topic to understand what has been done by scientists before you when they faced these biases. Understanding your data is usually rewarded with the development of a strong statistical intuition that will stay with you in all your future endeavours.
Conclusion
Most statistics is about summarising the randomness in the real world by collecting a sample and telling a story about the entire population. Most data is spread out around a central tendency but also tries to explain multiple dimensions that might not be summarisable by a single point of interest. Hence, advanced algorithms let you slice your data in various ways and summarise the characteristics of data in those slices. All samples that fall in a slice are expected to be representative of the population that the slice refers to.
If the sample is not representative of the population, the accuracy of your answer suffers. Your conclusions and predictions from such a study are inaccurate. There are those who understand this complexity and try to find a more accurate picture of reality. But there are also those who use this complexity to convince the readers of a biased truth.
That is just how statistics work.