The Statistical Nuances of Experimentation
Reference: This note details the first topic in the 7 broader topics of discussion in experimentation. Further, the points listed in this blog will be later converted into their own blog posts.
The scientific procedure seems simple to start with. You create a hypothesis, collect the relevant data for the experiment, then compare the samples for statistical significance, and voila "You have a finding." There is no doubt in the fact that once you start with the procedure, you will always reach a finding. It might be statistically significant or insignificant, the scientific community values both insights equally. There is virtually nothing that ever breaks down in the entire pipeline when a scientist decides to run an experiment.
An experiment is hence the easiest thing to do for a scientist. Writing about your finding is slightly hard, but most get through it in some way or the other. Getting your paper published is even harder, but if you decide to get into the grind of convincing reviewers you get through that as well. You finally publish a few papers and start calling yourself a scientist, which is when you realize that the biggest problem with science was never the scientific procedure itself but rather the trustworthiness of your findings.
Nature does not reveal it's secrets so easily. Nature has vicious ways to show you exactly what you are looking for. Nature would quietly cheat you in your experiments and let you live in the illusion of your own lies while letting you believe that you are a scientist who only believes in facts. There are many more ways to do faulty science, than there are to do it right.
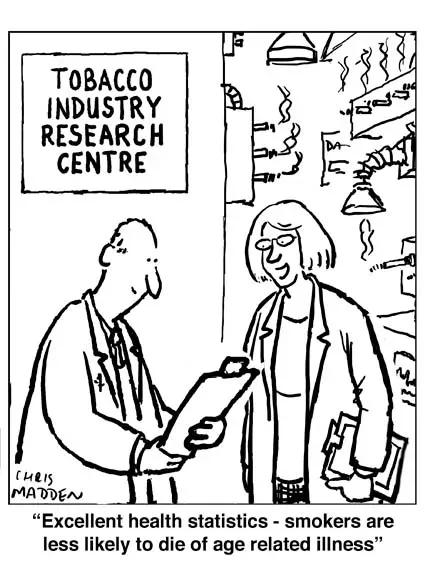
For instance, observe the cartoon above. The scientist at the Tobacco Industry Research Centre probably set out to find benefits of smoking and science showed him the benefit as he wanted it. Smokers are less likely to die of age related illnesses the cartoon says. The fact is true but still it is not a benefit because smoking does this by killing the person at an early age.
While science is a crook, statistics is its alibi. This post is a broader-level overview of the topics of finer nuance in statistics and how these different concepts often help science cheat its patrons the way it does. Later, I will write a detailed blog post on each of these topics.
Concepts of Statistical Nuances in Experimentation
While the discussion up till now dealt with the Bayesian vs Frequentist debate in statistics, the topics I am exploring in this blog are fundamental problems of statistics that both Bayesians and Frequentists have to deal with in their own ways. Some of these concepts have gained maturity with A/B testing as earlier there was not much data for experimentation anyways.
- False Positives and False Negatives: The calculations of statistical significance usually have a false positive and a false negative rate that all statisticians strive to control and mitigate. False positives (also called Type-1 errors) are cases when a difference is pronounced significant when actually it was not. False negatives (also called Type-1 errors) are differences that are not detected as significant when they were. Usually, there is a tradeoff between a false positive and false negative rate but invariably both exist in the statistical procedure to some extent (usually more than you can imagine).
- Power: The power of a statistical test is its true positive rate. So an 80% power means that there is an 80% chance that a significant difference will be truly detected as statistically significant in the test. Power is a crucial concept because statisticians actively look out for ways to increase the power of the test. Further, it is also a very delicate concept because power needs to be calculated before the test is started. Power calculated using observed data is called ad-hoc power and is usually not trustworthy. Power also suggests that you only calculate significance after the required sample size is collected and not in between.
- Visitor Efficiency: One of the very important metrics of significant testing procedures is how many visitors it needs to detect a difference. In modern A/B testing frameworks, false negatives are usually not a problem but visitor efficiency often is. False negatives are not a problem because you keep running the test till significance is achieved but the number of visitors lost to an insignificant difference is a crucial metric that can be optimized. Usually, it is very desirable to have optimizations that detect significance quickly so that you can quickly reject bad ideas and try out good ones.
- Effect Size-Sample Size Tradeoff: Effect size refers to the size of the difference that you want to detect in a test. Suppose, there are two routes to go from point A to B and I ask you is there a difference of at least 1 hour between the two routes. It would not take you very long to answer that question. On the contrary, imagine if I ask you is there a difference of at least 5 minutes between the two routes. As you can see, the second question is much harder to answer than the first one. Similarly, statistical significance calculations require much more sample sizes if you are trying to detect a smaller effect size. Bigger effect sizes are detected much more quickly because of the stark difference. In my experience, I think the statistical nuance is not intuitive to many experimenters.
- Region of Practical Equivalence (ROPE): A powerful concept related to the effect size-sample size tradeoff is the concept of the region of practical equivalence. Most statistical significance engines use data to validate the hypothesis that the variation is better than the control or not. However, better can be anything. Even a 0.01% improvement can "theoretically" be better but in practice, most experimenters are looking for a substantial improvement (for instance, 3-5% relative improvement is the standard in digital marketing). By incorporating the concept of ROPE in the calculation of statistical significance, you allow the system to reduce the number of false positives and also end tests early when improvements are less than the desired threshold. ROPE as a concept has widely different manifestations in Frequentists and Bayesian statistics.
- The stationarity assumption: Any framework for significance calculations assumes that the underlying process from where the data is being collected does not change with time. In statistical jargon, this property is called "stationarity". Usually, this assumption is heavily violated in A/B testing. Suppose you have an e-commerce website that observes much higher sales over the weekend. You can see that if an A/B test is run on such a website, the underlying data-generating process will change between weekdays and weekends. When the stationarity assumption is violated, the timing of the start and end of the test matter a lot, and false-positive rates increase.
- Multiple Comparison Problem: Whenever you are making more than one comparison in a test, you are invariably increasing the false positive rate. Suppose that in an experiment you create 20 different variations of a page (say you randomly tried 20 background colors) and compared them against the control. If the false-positive rate of the significance test is 5%, then there is a 100% chance that at least one of those variations will come out to be the winner just by chance. Multiple Testing is a problem that comes up at many places in experimentation and some ways such as the Bonferroni correction or the Sidak correction try and reduce its impact.
- Variance Reduction Techniques: A bunch of optimizations have been developed that reduce the variance of the two samples being compared so that statistical significance can be quickly detected (with fewer samples). One example of this is a paired t-test that smartly maps the samples in the control group to samples in the treatment group and hence reduces the variance of the difference. Another such technique is CUPED which uses pre-experiment data to reduce the variance of the samples and hence reduces the number of samples needed.
- Sample Ratio Mismatch: A Sample Ratio Mismatch (SRM) is a newly emerging concept in online experimentation and has been called the seatbelt of A/B Testing. The central idea is simple. If you allot a 50-50 allocation to control and variation and your observed traffic allocation are say 55-45, then probably there is an issue with the test and the test requires debugging. Usually, false-positive rates in cases where an SRM is found are high and test results cannot be trusted.
- Covariate Balancing: A concept similar to Sample Ratio Mismatch is of covariate balancing. Suppose that you run a test on your website trying to find out if changing the color of the "Donate" button increases revenue collection on your website. Now suppose that your test runs across the entire world but purely by chance the proportion of US visitors (who pay higher in general) on the variation is higher than that on control. The US in this case is a covariate and even if the change in color is not doing anything, you will start to see that the variation has performed better. Randomized Control Trials were specifically designed to cancel out the effect of any covariates but in cases where covariates are imbalanced, your false-positive rates do increase.
- Outliers: Outliers create havoc in the procedure to calculate statistical significance because outliers distort the mean very much. But the complexity is that sometimes outliers are helpful whereas sometimes they are not. If you are trying to see if a new banner leads to bigger donations on your website, then probably what you are wanting to look at is the effect of increased outliers. There are many ways to handle outliers statistically, but before everything else, it is a business call to decide if outliers are valuable in your test or not.
- The population prevalence: One might like to think that false positives are solely a property of the testing procedure but it is not so. Take this example from Fooled By Randomness by Nasim Nicholas Taleb. Suppose that there is a disease that happens to 1 in 1000 people in the world and there is a test to detect it with a 5% false-positive rate. Now, if 1001 people (1000 without the disease, 1 with the disease) decide to take the test then almost 51 people will be tested positive (50 false positives and 1 actual positive case). So, if you see that although the false positive rate was just 5%, the actual chance of the test being wrong when a disease is detected is almost 98% (50/51). Hence, it must be noted that false-positive rates are not just dependent on the testing procedure but also on the prevalence of positive cases in the population.
The way ahead
The nuances mentioned above are not an exhaustive set of statistical nuances in testing but one of the most popular ones. I will keep updating this list as I find more interesting problems. As we go forward in this blog, I will write a detailed note on each of these issues and explain each of the problems in detail with examples.