
The Paradox of Statistical Power

Context: This is the second article in the series, The Statistical Nuances in Experimentation. The parent-blog will give you a broader context to the concepts discussed in this article.
While false positives are a curse to experimentation, one of the ways to increase trust in your experiments is by increasing the sample size of your study. This is something that most of us understand intuitively but a t-test seems to do its work irrespective of whatever sample size you give it. Many scientific studies are often refuted with the claim that the sample size was not large enough to make the study conclusive. As a result, you often see medical researchers hounding statisticians to tell them an appropriate sample size that will help them maximize their statistical power. But the truth is calculating statistical power is hard for most experimenters because it is paradoxical by nature. Explaining this paradox is the focus of this blogpost.
Statistical Power is the core concept in hypothesis testing that builds the bridge between the accuracy of a test and the sample sizes it uses. It is defined as the expected true positive rate of the test corresponding to a sample size. There are two more ingredients to the equation of statistical power that are interesting to study - The Minimum Detectable Effect (or the effect size) and the Standard Deviation of data. Understading the equation of statistical power, helps you develop a sense of how different things relate to the accuracy of statistical tests.
The determinants of Statistical Power
Most interesting equations are interesting because they define a model for a naturally occuring phenomena. Most equations also get invalidated when better causality of that phenomena is discovered by science. But some equations stand the test of time much longer than most equations because they correspond to fundamental relationships in nature. Statistical Power is one such equation.
I would not mention the actual equation in thie blog because it is a bit long to explain and I don't want to open a pandora box that hurts the flow of this blog (can be read here). Implementation of statistical power in any programming language can usually be done easily with a library function (can be read here).
The core parameters that the equation ties are as follows:
Alpha and Beta: The accuracy of a hypothesis test is usually controlled by two parameters that are the false positive rate (alpha) and the false negative rate (beta). The false positive rate and the true negative rate sum up to 1. Further, the true positive rate (statistical power) and the false negative rate sum up to 1 as well (See the featured image of this Wikipedia article to get an intuition). Note that the statistical power (true positive rate) can be calculated as 1 - beta.
Essentially, these are the two handles that let you define the accuracy of the system. The reason that there are two handles and mathematicians haven't reduced it to one is because false positives and false negatives costs may differ across applications (a concept explained in the previous blog).
Sample Sizes: Sample Sizes are mostly the output of the statistical power equation but in practice there is no harm in defining the sample size first and then calculating the statistical power achievable with that sample size.
Minimum Detectable Effect (MDE): The minimum detectable effect is a crucial part of experimentation statistics and is rarely talked about in the experimentation community outside statisticians.
To understand the relevance of Minimum Detectable Effect, you need to understand something interesting. Look at the figure shown below, observe that it is a fundamental law of nature that bigger differences are easier to detect whereas small differences are very hard to detect. It is likewise for statistics. The number of sample sizes you will need depends on the size of the change that you are trying to detect.

Standard Deviation of Data: As explained earlier in the article on t-tests, the standard deviation is a fundamental component in deciding if a difference is statistically significant or not. If the effect size (MDE) is large in respect to the standard deviation of data, the difference is considered significant and if the effect size is small or comparable to the standard deviation in data, the difference is considered to have been observed by chance. Hence, to say clearly statistical power is impacted by MDE in ratio of the standard deviation.
The Paradox of Statistical Power
The four components of statistical power seem easy to calculate. Alpha and Beta are fixed by the desired preference towards false positives and false negatives of an experimenter. Sample Size are to be calculated. The MDE even though slightly hard to estimate but can still be calculated from the observed effect-size from the experiment. Finally, the standard deviation of data can be calculated from data once some datapoints are collected.
But there is a catch.
The number of samples you should collect is a question you ask before the data is collected. However, to calculate this sample size, the equational components need information from the collected data. Many experimenters resort to calculating the required sample size on the fly while data is being collected. This means that as more and more data is collected estimates of the effect-size and standard deviation get more and more accurate and hence the sample size estimation also becomes accurate on the fly.
Or you can spin the story around. Keep collecting samples and calculate statistical power on the fly. As soon as the statistical power reaches a fixed threshold you can stop the test and infer the results of the experiment. However, this implementation of statistical power is vulnerable to inaccuracy and is called ad-hoc power.
The statistical power that is calculated including the data from the experiment it is being calculated for is called ad-hoc power. Statisticians have warned time and again that adhoc power can be more inaccurate than you can imagine. True statsitical power is calculated before the experiment and never changed after observing the real world data.
So, statistical power has two components that can only be calculated from the data collected but it does not allow you to look at the data collected or else statistical power is biased. This is the paradox of statistical power that makes it so unpopular among non-statisticians.
The way ahead
I yet have to fully explore the concept of statistical power but from what I know as of now, the statistical power makes it necessary to define a Minimum Detectable Effect (MDE) in advanced. The effect-size gets reduced to MDE because, the statistical power will always be greater (and sample sizes smaller), if the true effect size is greater than MDE. Hence, we have handled one side of the inequality.
Estimates of standard deviation are usually taken ball-park or from past data (not part of the experiment) and it is handy to keep standard deviation to be greater than expected. Most mature experimenters in practice resort to this solution of statistical power.
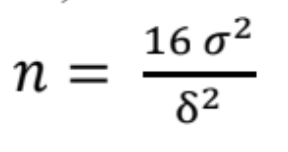
As a usable rule of thumb, a popular equation to calculate Sample Sizes is the Lehr's formula, for a standard alpha of 0.05 and a statistical power of 80% (beta: 0.2)
In the next blog, we will take our discussion on sample sizes further. Sample Sizes are also one of the two most important optimizable parameters of a hypothesis test, the other one being false positive rates.