The Multiple Comparison Problem

A special thanks to Georgi Georgiev who reviewed the simulational results presented in this blog post and helped me remove errors from my analysis of Alpha Spending.
Once you start to deal with uncertainty, you realize that it is intuitively very different from the concepts of a deterministic world. For instance, if I was to ask you, can a monkey write Hamlet?, you will be very quickly tempted to tell me that it is far from possible. In a perfectly deterministic world, it is a True-False question and a single instance of a monkey who writes Hamlet would prove you wrong. That's just how deterministic systems work. If 2 + 2 is 4, then even a single instance of 2 + 2 = 5 is enough to disprove the original statement.
But welcome to randomistan (a world where things are random), intuition works very differently here. Nasim Nicholas Taleb explains that if an infinite number of monkeys were made to sit in front of an infinite number of typewriters, randomly hitting the keys, then one of them would certainly produce Hamlet. Logicians might be quick to point out that true infinity is not possible and hence this thought experiment does not tell anything about the real world. But the thought experiment tells something very interesting about the real world. With enough population, the chance of observing even the most unlikely things multiplies in randomistan.
So to explain in a real-world scenario, suppose that you are analyzing mutual fund managers and come across one who has shown consistent profits every month in the past year. Assuming that there is a 50-50 chance of making a profit or a loss in a month for a novice (a monkey), the chance that a novice has that record is very very low (0.5^12 = 0.02%). So, probably there is a huge likelihood that the mutual fund manager actually is not a novice (a monkey) and actually has the skill to make profits every month. Taleb tells you that this reasoning is in fact wrong. You need to take into consideration how many mutual fund managers were you analyzing in the first place (the size of your population).
If you just analyzed a dozen managers out of your contacts then yes it is a huge deal that someone came up with that record. But if you analyzed 10,000 mutual fund managers on LinkedIn, then probably it is not a huge deal that 1 of those 10,000 mutual fund managers actually had that record (just by chance). In fact, to a statistician, it would rather have been surprising if not even one of those 10,000 managers showed a record that had a 0.02% likelihood purely by chance.
In short, the probability that the mutual fund manager you found is not a monkey depends on the population size you were evaluating. If you get this, you get the fundamental intuition behind the Multiple Comparison Problem and will be able to identify the errors associated with it.
Most A/B Testing mechanisms have about a 5% false positive rate (FPR) but this means that the 5% FPR holds only if you calculate statistical significance just once in the lifetime of the test. If for any reason you calculate statistical significance more than once the false positive rates inflate. There can be multiple reasons due to which you are calculating statistical significance more than once. You might be calculating significance multiple times during the data collection process. You might be having more than one variant in the test. You might be running the test for more than one goal. Everytime you calculate statistical significance more than once, the false positive rates are inflating by design. A good rule of thumb to know is that if you calculate significance 'n' times (due to whatever reasons), your False Positive Rates are actually 5%*n.
Sequential Testing and the Problem of Peeking
A/B Testing in the industry is expensive and all tests require the experimenters to invest visitors in the test. To test an idea, you would have to be prepared to divert some traffic to the idea even if it happens to be hurting your conversion rates. But in practice, most experimenters want to end a failing test as quickly as they can. Hence, the experimenter is logically motivated to look at the results multiple times during the duration of the test and take a decision as quickly as they can.
However, this logical motivation leads to the multiple comparisons problem and hence false positive rates in A/B testing often come out to be much higher than the desired 5%. The problem has been repeatedly highlighted by experimenters as the problem of peeking and A/B testing vendors like Optimizely (with Always Valid P-values) and VWO (with their Bayesian Stats Engine) have tried to provide a resolution for the same.
Some experimenters like Lukas Vermeer openly state that they are not a fan of sequential testing and rather prefer fixed horizon testing. With fixed horizon testing, you calculate the desired sample size beforehand and commit to only seeing the results once after the desired sample size has been collected. This way you ensure that the false positive rates are controlled within the desired range.
In the past few years, the need for sequential testing and the hazards of peeking have both been highlighted aggressively by experimenters around the globe. While some experimenters have renunciated sequential testing in the favor of fixed horizon testing, others have stuck with their demand of sequential testing and motivated vendors to develop a solution. But most solutions come at a cost and vendors have repeatedly realised that there is no free lunch in the game.
Always Valid P-values and Alpha Spending
Two statistical solutions have largely been innovated in the industry to address the problem of multiple comparisons. In this section, I describe both solutions along with their implications. The first popular solution, "Always Valid P-values" was introduced by Ramesh Johari in collaboration with Optimizely. The second popular solution, "Alpha Spending" was implemented and popularised by Georgi Georgiev from Analytics-Toolkit.
Always Valid P-values are interesting as they calculate significance by taking a ratio of the null hypothesis to the alternate hypothesis (read here on null hypothesis) and integrating it over the prior probability of uplifts defined by the system. Always Valid P-values are rooted in a Frequentist ideology but have interestingly moved beyond the Bayesian vs Frequentist debate and incorporated ideas similar to Bayesian prior probabilities and the Bayes Factor. As a result, Johari seems to have done magic coming up with a conservative system that maintains false positive rates even under consistent peeking. But the tradeoff has been to statistical power. For small uplifts in conversion rates (which are more common), always valid p-values take longer than alpha-spending.
The beauty of Alpha-Spending lies in the fact that it is simpler as an idea compared to Always Valid P-values. Alpha Spending says that False Positive Rates (denoted by alpha) are like dimes in a pouch. Every time you want to peek into the result, you need to spend a few dimes. So, if you have 5% overall you can create a peeking schedule where you will peek 10 times till the desired sample size is reached. Every time you peek, you spend only 0.5% of your FPR budget. This means that you will only accept the winner if your p-value < 0.005 (as opposed to 0.05 in the case of a fixed horizon test). The discussion on alpha spending further evolves into the interesting ways you can allocate your budget to different peeks.
Always Valid P-values and Alpha Spending both have been interesting additions to the toolkit of a rigorous experimenter. The results I have obtained for both the approaches in my simulations are beautiful. Both seem to fulfill their promise leaving the reader befuddled on where is the free lunch coming from and what is the tradeoff between the two. The choice one makes will always be personal, but the broader picture looks satisfying to say the least.
In the next section, I juxtapose the simulational results of both approaches along with the baseline of what happens when you peek with simple p-values.
Simulations on Always Valid P-values and Alpha Spending
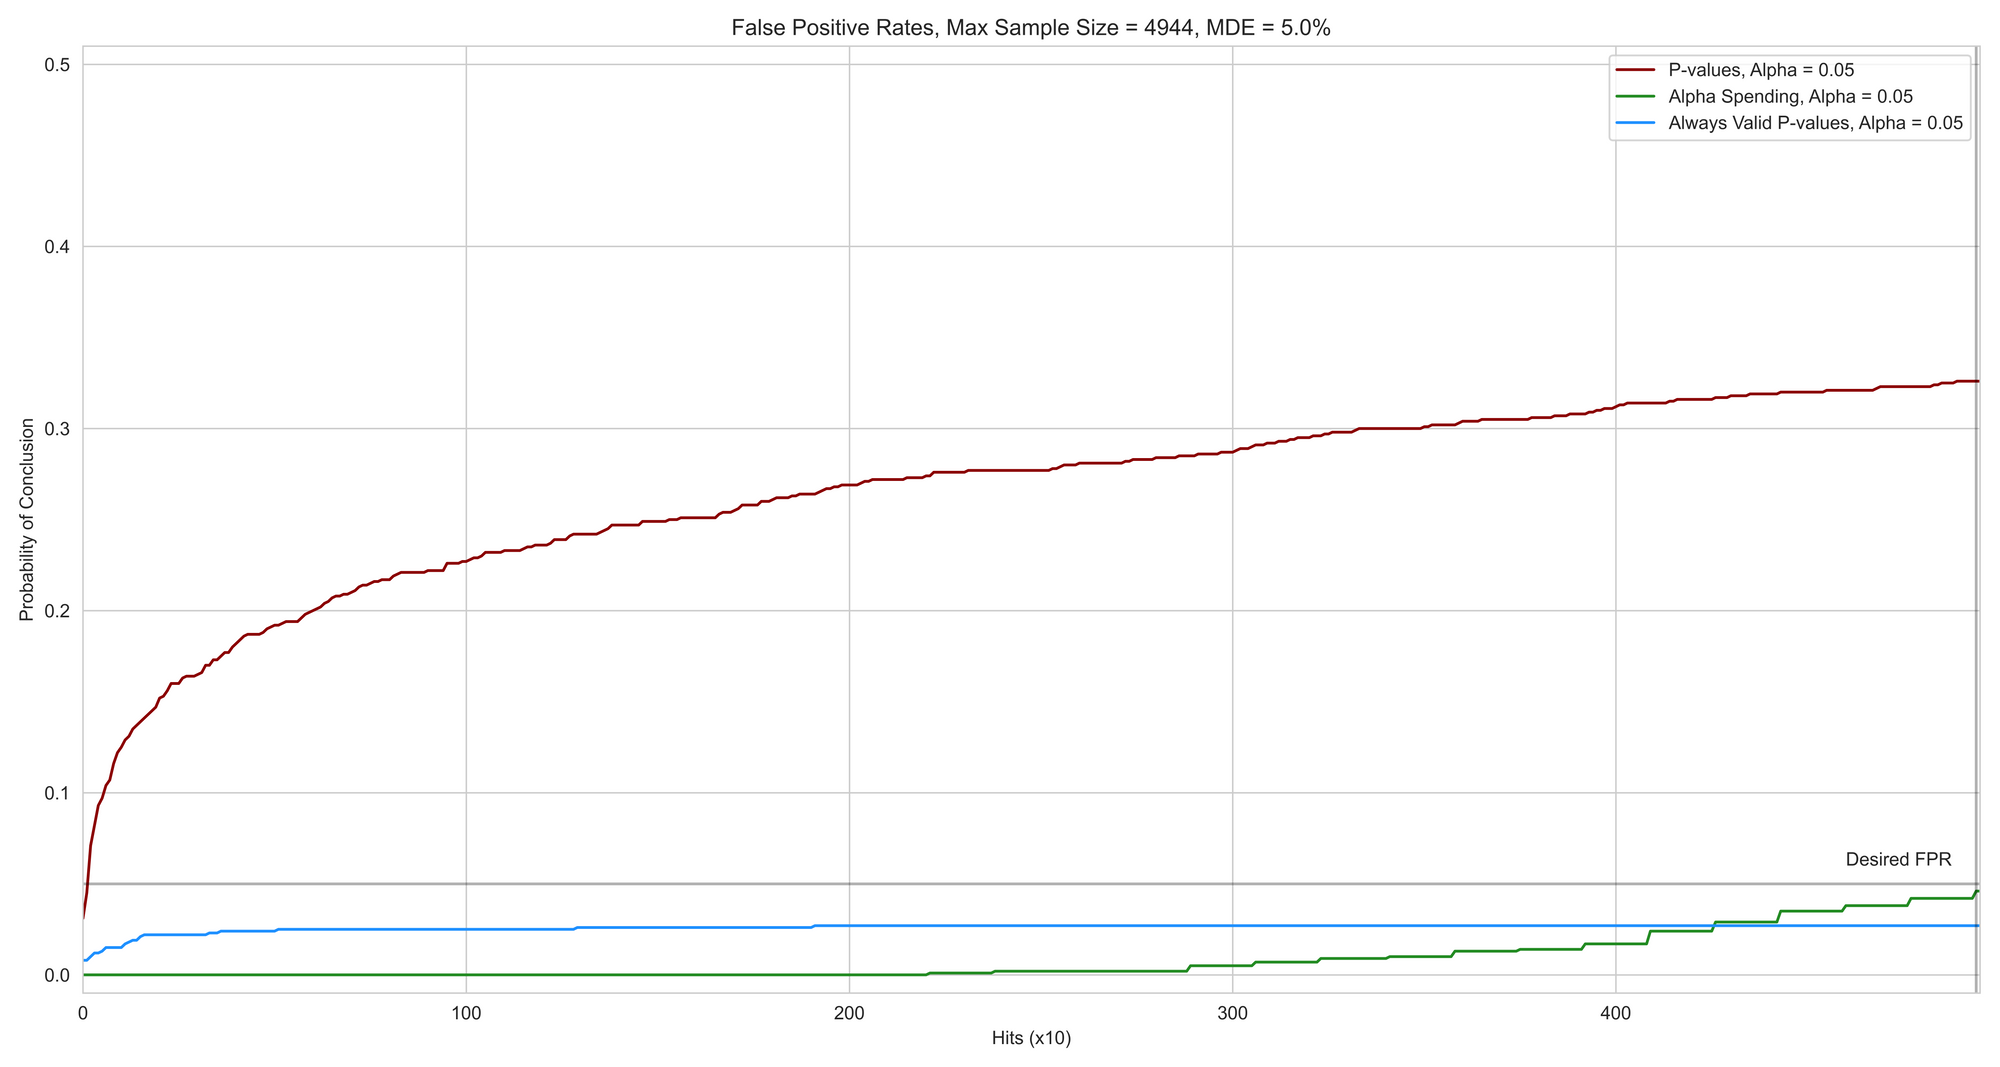
The following simulations were run with mean 1 and standard deviation 1 in the control group. Further, all numbers were averaged over 1000 A/B tests. Peeking was done at every 10 visitors up till 10,000 visitors (except for in Alpha Spending where the peeking schedule was followed). The red line shows the baseline where you are peeking with p-values (no correction). The green line shows the case of alpha spending with an O'Brien Fleming budget spending function. The blue line shows the Always Valid P-values.
False Positive Rates
Voila! Observe the beauty of how efficiently both approaches control for false positive rates as claimed by them. The graph below shows the proportion of winners declared in 1000 true A/A tests by the three approaches.
Also, observe the beautiful step function that has come up as you spend the alpha dimes from your small alpha pouch.
Compared to peeking with simple p-values, it is clear that both approaches seem to be solving the problem at hand.
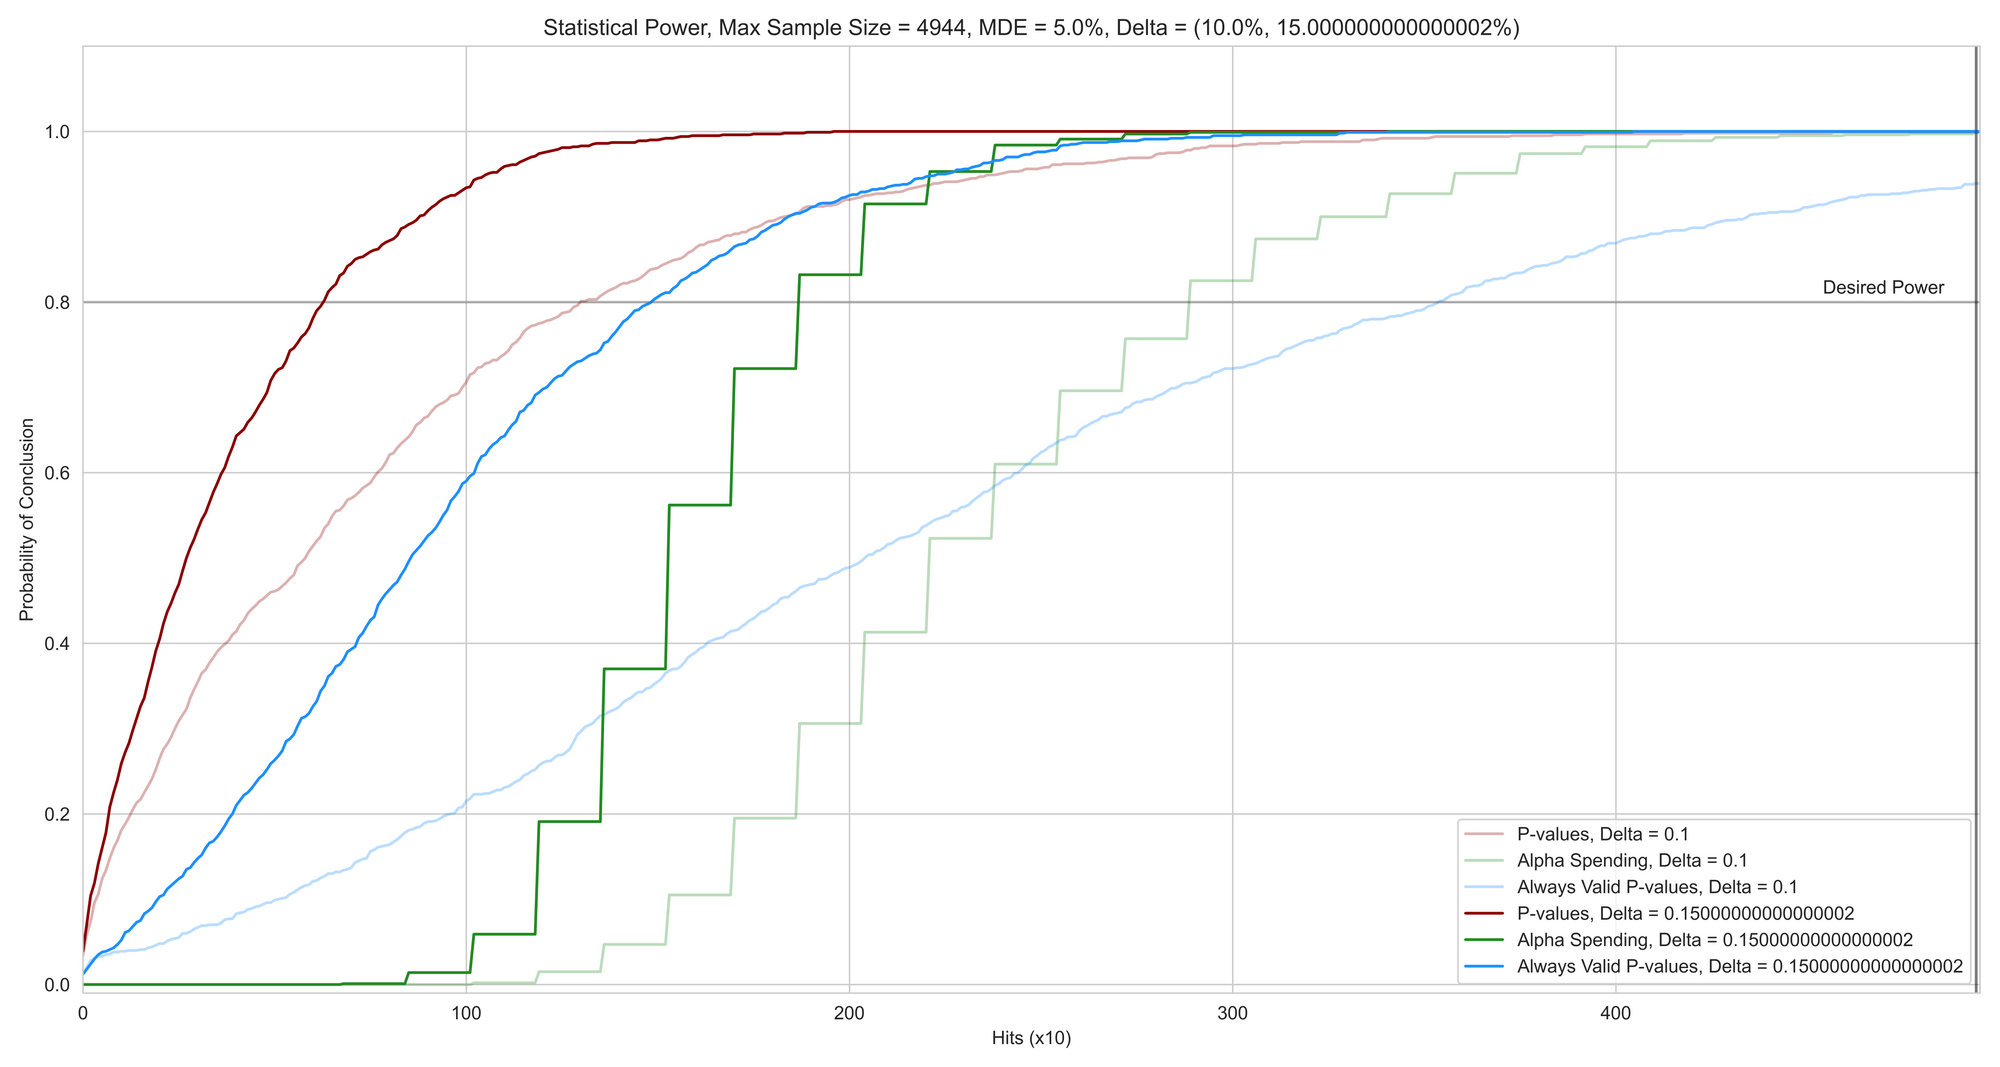
Statistical Power
But at the cost of what? Statistical Power is the capability of the methodology to detect true differences in an A/B test. I show two cases of 10% and 15% uplifts and how well do the methodologies detect these differences over 1000 A/B tests each.
They say there is no free lunch in society. Observe the tradeoff in both approaches for statistical power. In an attempt to reduce false positives, it is clear that true differences are detected slower than the baseline approach.
But, the question remains which approach is better? Always Valid P-values or Alpha Spending. The answer begs a third graph that I show next.
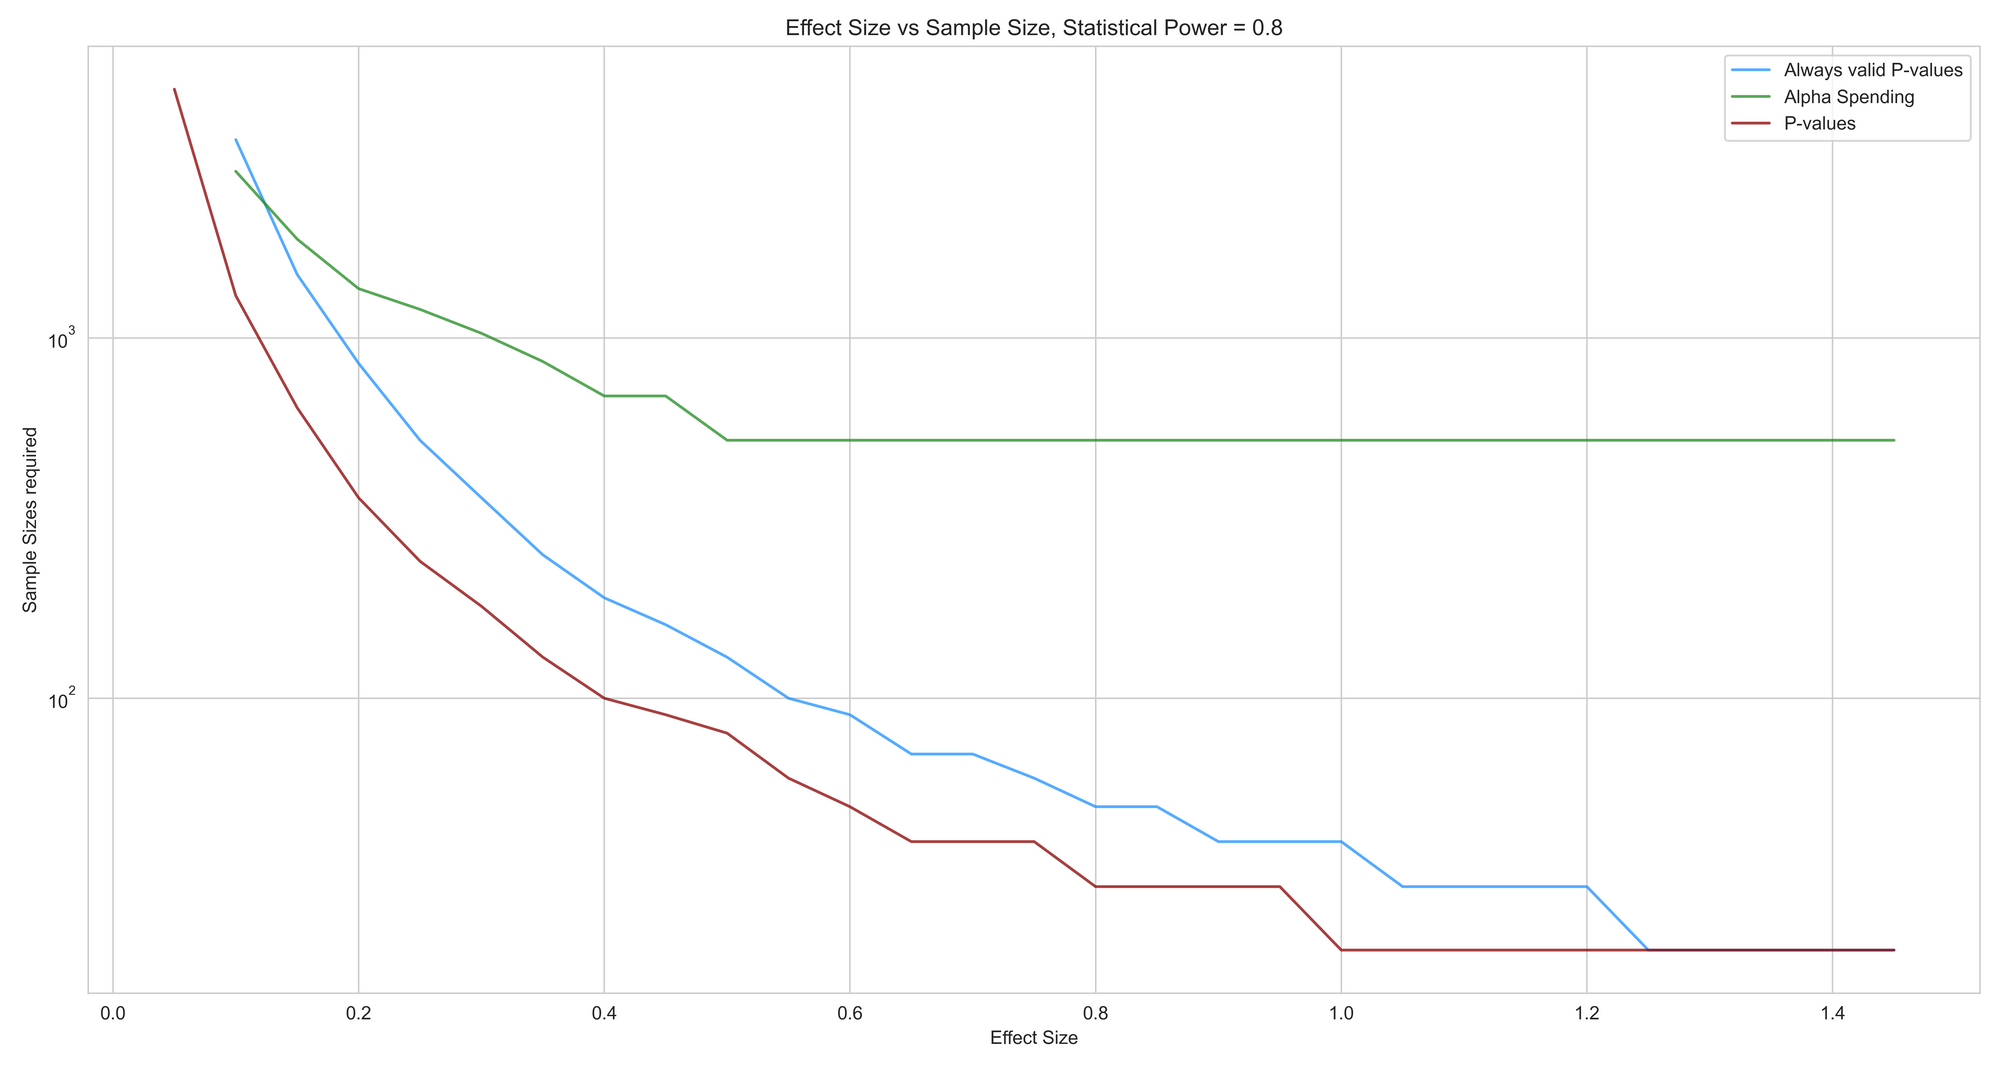
Effect Size vs Sample Size
The graph below shows a different take on statistical power. How many samples are needed for different effect sizes to be detected with an 80% statistical power. Note that sample sizes are on the log scale.
It is true that Always Valid P-values detect larger differences much faster than Alpha Spending and hence one might argue that it might be the better approach.
But then, one might also argue how common is it anyways to run an A/B test that gives a larger than 15% uplift (below which Alpha Spending performs better).
Conclusion
Multiple Comparison is a fundamental problem of statistics grasping the intuition of which helps you understand how to deal with improbable events in randomistan. The next time someone calls you up to tell a spooky story of the twin brothers who died on the same spot by the same taxi riding the same moped, think about how many twin brothers in history would have actually escaped the coincidence.
Co-incidences and unlikely events are interesting to observe but always think about the population size in your consideration before gasping at them in randomistan.